
In the month of November 2020, there were a total of 14 visualizations that were selected as Visualization Of The Day. All the vizes that appear on VOTD do a wonderful job on Viz design and in narrating a story with data.
The most impressive visualization for me in November VOTD was Viz For Social Good by Sam Parsons (Twitter), in which he talks about the impact of the #VizforSocialGood initiative. This initiative helps nonprofits to use the power of their data and to promote social good through data storytelling. The impressive thing about this viz is that it is made in one single sheet. Check it out here.
Another viz that grabbed my attention is The Originals by Brian Moore (Twitter) where he is showing how music’s greatest influencers shaped the music landscape. This is a great example of how to use Action Parameters to change the metrics on the go. Check out the viz here.
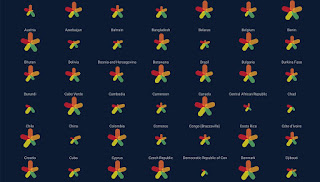
The third most intriguing viz to me was The Shape of Democracy, built by George Gorczynski (Twitter). In this viz George visualized the state of democracy in 165 independent states and 2 territories. With this viz you can learn how each country (or territory) scored across five categories, namely political participation, civil liberties, political culture, the functioning of the government, and electoral process and pluralism. This viz is a great example of using Viz in the tooltip to show additional details and patterns. Checkout this Viz here.
Congratulations to all the VOTD winners of November 2020. You have done a stunning job. 👏










Post a Comment